|
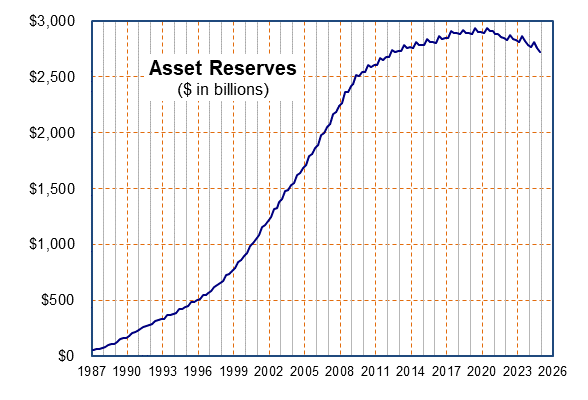
Investments held at the end of September 2004 by the Old-Age, Survivors, and Disability Insurance Trust Funds 1,635,397,934,000.00 dollars. That's one trillion, 635 billion, 397 million, 934 thousand dollars held in government guaranteed securities. The average interest rate, weighted by the amount invested at each rate, is 5.525 percent at the end of September 2004. Similarly, the average number of years to maturity, weighted by the amounts maturing, is 7.701 years. And each year more money is being paid into the trust fund than is being spent for old age, survivors and disability benefits. The fund isn't broke. So don't "fix" it! The amount of trust fund investments should exceed two trillion dollars in just a few years. At the end of 2003, trust fund investments in government securities totaled 1,530,363,559 and just nine months later that had increased to 1,635,397,934. That's a 105 billion dollar increase! The sky is falling, the sky is falling! Let the facts speak for themselves. Old-Age, Survivors, and Disability Insurance Trust Funds, 1957-2003 Year End Assets After All Benefits Were Paid
1957 23,042 23 billion, 42 million dollars
1958 23,243
1959 21,966
1960 22,613
1961 22,162
1962 20,705
1963 20,715
1964 21,172
1965 19,841
1966 22,308
1967 26,250
1968 28,729
1969 34,182
1970 38,068
1971 40,434
1972 42,775
1973 44,414
1974 45,886
1975 44,342
1976 41,133
1977 35,861
1978 31,746
1979 30,291
1980 26,453
1981 24,539
1982 24,778
1983 24,867
1984 31,075
1985 42,163
1986 46,861
1987 68,807
1988 109,762
1989 162,968
1990 225,277
1991 280,747
1992 331,473
1993 378,285
1994 436,385
1995 496,068
1996 566,950
1997 655,510
1998 762,460
1999 896,133
2000 1,049,445
2001 1,212,533
2002 1,377,965
2003 1,530,764 One trillion, 530 billion, 764 million dollars.
Social Security Trust Fund assets are projected to increase to over 5 trillion dollars by 2018.
Ya. It's a real "crisis" all right. And it's getting worse every day!

|