Democratic Underground Latest Greatest Lobby Journals Search Options Help Login
Google

Graphs Detailing The Employment Situation

Printer-friendly format Printer-friendly format
Printer-friendly format Email this thread to a friend
Printer-friendly format Bookmark this thread
This topic is archived.
Home » Discuss » Topic Forums » Economy Donate to DU
 
RedEarth Donating Member (1000+ posts) Send PM | Profile | Ignore Sat Dec-06-08 10:32 AM
Original message
Graphs Detailing The Employment Situation


Manufacturing employment, seasonally adjusted. NBER defined recession dates shaded gray (assuming recession has not ended by 2008M12). Source: BLS, employment situation via St. Louis Fed FRED II


more here......

http://www.econbrowser.com/archives/2008/12/the_employment.html
Printer Friendly | Permalink |  | Top
Citizen Number 9 Donating Member (878 posts) Send PM | Profile | Ignore Sat Dec-06-08 02:29 PM
Response to Original message
1. No offense meant, but....
Don't need no steenking graphs to know it is really bad.

I am not a conspiracy theorist, but am convinced that if you read the numbers and graphs generally seen, you don't fell it is as bad as itis.

Is this a problem? Not for us as a whole, because doom and despair will hurt the economy even more, but I think it does a disservice for those on the margins as it may keep them from doing what they should do to adequately protect themselves and their families from economic downturn.

You still have folks who say things are pretty good and while that may be true for them individually, it is JUST PLAIN INCORRECT for the country as a whole. Problem being that the impact can come to you very very quickly, even if you think you are immune so far.
Printer Friendly | Permalink |  | Top
 
CoffeeCat Donating Member (1000+ posts) Send PM | Profile | Ignore Sat Dec-06-08 02:34 PM
Response to Original message
2. Is it even WORSE than this graph shows?
I'm recalling information from a couple of years ago, so bear with me:

Didn't Bush officially re-define what a "manufacturing job" is? Didn't he widen
the definition of a "manufacturing job" to include hamburger flippers and other
such jobs?

Are those numbers on the aforementioned graph, based on Bush's new definition
of a manufacturing job?

If so, we're even more screwed than the graphs shows, because that graph (if
based on Bush's world view) shows a horrendous crash, despite Bush's effort
to add many new jobs into the definition of "manufacturing jobs."

Yikes.
Printer Friendly | Permalink |  | Top
 
Festivito Donating Member (1000+ posts) Send PM | Profile | Ignore Sun Dec-07-08 06:19 AM
Response to Reply #2
5. Manufactured hamburgers, maybe that's when it plateaued.
Can we muster enough manufacturing to revive this country?
Printer Friendly | Permalink |  | Top
 
unlawflcombatnt Donating Member (1000+ posts) Send PM | Profile | Ignore Sat Dec-06-08 11:01 PM
Response to Original message
3. It's actually Worse
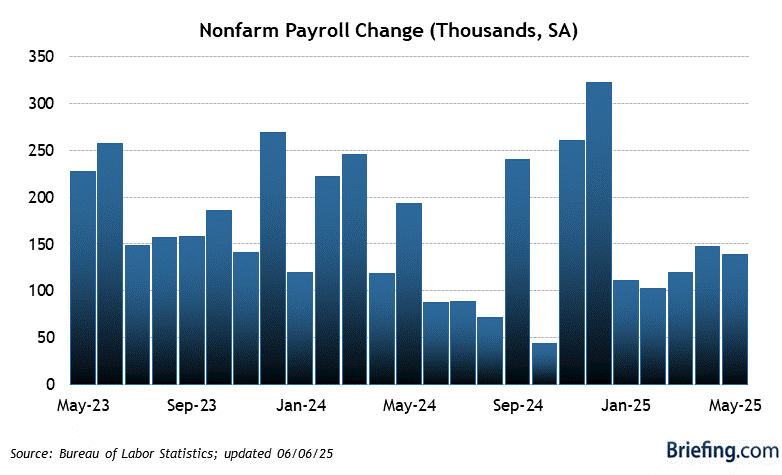
We've had 11 straight months of Payroll employment declines, as can be seen in the chart below:


But the BLS's Household Survey, which is supposed to represent ALL American jobs, paints an even bleaker picture of Friday's job report (for November, 2008). In the 1 year since November 2007, the US has lost -2.3 million jobs. That's a -1.37% fall in US employment over the last year. Below is a modified chart from the BLS showing the jobs losses. (the November 07 and 08 employment and unemployment numbers are underlined in red.)
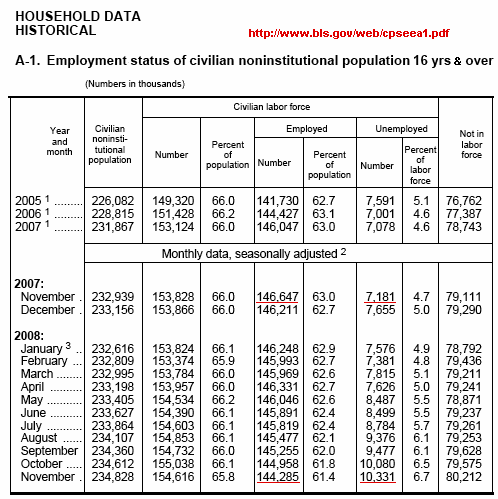


According to the Household Survey, the total loss of American jobs for November was -673,000. According to the survey, the number of jobs lost in the last 2 months alone is ~1 million.

888K more workers were out of work in November (including both the officially unemployed and "discouraged" workers.)

The most striking number, however, is Unemployment. Since November of 2007, the number of Unemployed Americans has increased by over 3 million (from 7.181 million in November 2007 to 10.331 million in November 2008).

In the 12 months since November 2007, the number of potential workers (i.e., non-institutionalized persons age 16 and over, or "working age" persons) has increased by +1.9 million.1
Printer Friendly | Permalink |  | Top
 
rosesaylavee Donating Member (1000+ posts) Send PM | Profile | Ignore Sun Dec-07-08 12:45 AM
Response to Original message
4. Well Thank God it's not as bad as I thought it was...
You kinda had me scared there before I saw the graph.
Printer Friendly | Permalink |  | Top
 
DU AdBot (1000+ posts) Click to send private message to this author Click to view 
this author's profile Click to add 
this author to your buddy list Click to add 
this author to your Ignore list Mon Jan 13th 2025, 08:28 PM
Response to Original message
Advertisements [?]
 Top

Home » Discuss » Topic Forums » Economy Donate to DU

Powered by DCForum+ Version 1.1 Copyright 1997-2002 DCScripts.com
Software has been extensively modified by the DU administrators


Important Notices: By participating on this discussion board, visitors agree to abide by the rules outlined on our Rules page. Messages posted on the Democratic Underground Discussion Forums are the opinions of the individuals who post them, and do not necessarily represent the opinions of Democratic Underground, LLC.

Home  |  Discussion Forums  |  Journals |  Store  |  Donate

About DU  |  Contact Us  |  Privacy Policy

Got a message for Democratic Underground? Click here to send us a message.

© 2001 - 2011 Democratic Underground, LLC