That presentation of data is not the sentiment that the underlying poll reveals. First, here is a clear image of public support for nuclear:
Associated Press/Stanford University Poll conducted by GfK Roper Public Affairs & Media. Nov. 17-29, 2009. N=1,005 adults nationwide. MoE � 3.1.
"In general, would you favor or oppose building more nuclear power plants at this time?"
Favor 49 Oppose 48 Unsure 3
***********************************************************************
CNN/Opinion Research Corporation Poll. Oct. 16-18, 2009. N=1,038 adults nationwide. MoE � 3.
�To address the country�s energy needs, would you support or oppose action by the federal government to ?� (Half Sample)
"Increase coal mining"
Support 52, Oppose 45, Unsure 3
"Build more nuclear power plants"
Support 52, Oppose 46, Unsure 2
"Develop more solar and wind power"
Support 91, Oppose 8, Unsure 1
"Increase oil and gas drilling"
Support 64, Oppose 33, Unsure 3
"Develop electric car technology"
Support 82, Oppose 17, Unsure 2
"Require more energy conservation by businesses and industries"
Support 78, Oppose 20, Unsure 2
"Require more energy conservation by consumers like yourself"
Support 73, Oppose 25, Unsure 3
"Require car manufacturers to improve the fuel-efficiency of vehicles sold in this country"
Support 85, Oppose 14, Unsure 1
Asked of those who support building more nuclear power plants:
"Would you favor or oppose building a nuclear power plant within 50 miles of your home?"
Favor 66, Oppose 33
What the graphs stats used charts is actually how worried people are about energy and climate. The underlying poll asks if nuclear should be
"one of the ways" to provide electricity for the US.
Influences on that graph:
1) Nuclear already IS one of the ways, so the reader must be in favor of decommissioning nuclear power in a time of uncertainty regarding energy security and climate change to be "opposed".
2) The answers are divided into 4 categories; and what isn't shown is that the shift to "strongly support" has only changed a couple of percentage points.
3) When you compare the Gallup poll with the two posted above (those are typical of polling on the issue) you can see the way energy security is a higher priority than environmental issues for those who state direct support for nuclear power as it is identical to the results for building more coal plants, and tracks the approval of drilling for petroleum closely.
The use of that graph is a standard attempt to create foster "the bandwagon effect"

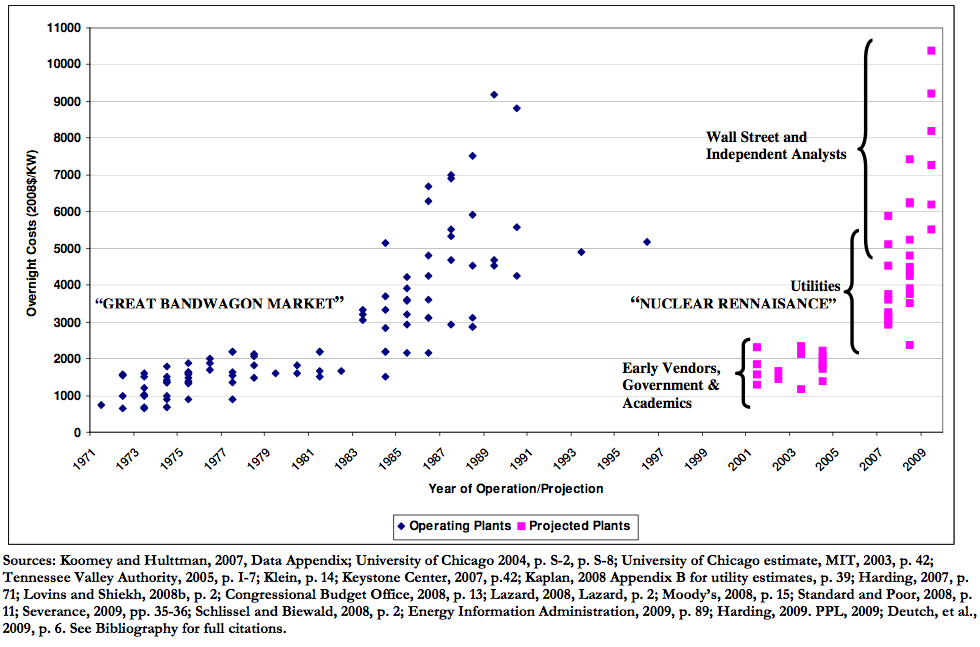
I wonder what the results of polling would be if respondents were shown this graph first:

Full cost report by Cooper here:
http://www.olino.org/us/articles/2009/11/26/the-economics-of-nuclear-reactors-renaissance-or-relapsehttp://www.olino.org/us/articles/2009/11/26/the-economics-of-nuclear-reactors-renaissance-or-relapse