The end of summer is approaching in the Arctic; temperatures are dropping and melt is ending in the high latitudes. Yet summer is not quite over in the lower latitudes of the Arctic Ocean, where sea ice extent continues to decline. Sea ice has melted out extensively in the northern route of the Northwest Passage, but the passage is not completely open.
Meanwhile, in the Antarctic, sea ice extent continues to be well above normal, largely because of atmospheric circulation patterns set up by a high Antarctic Oscillation mode.
Overview of conditions
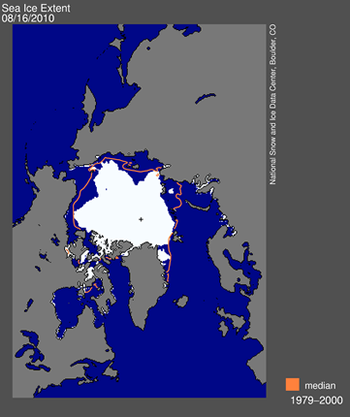
As of August 16, 2010, Arctic ice extent was 5.95 million square kilometers (2.30 million square miles),1.68 million square kilometers (649,000 square miles) below the 1979 to 2000 average.
EDIT
http://nsidc.org/arcticseaicenews/index.htmlFigure 1. Daily Arctic sea ice extent on August 16 was 5.95 million square kilometers (2.30 million square miles). The orange line shows the 1979 to 2000 median extent for that day. The black cross indicates the geographic North Pole.
Conditions in context
As of August 16, only 2007 and 2008 had lower extent. Approximately one month remains in the melt season.
High pressure has moved in over the central Arctic Ocean, replacing stormier, lower-pressure conditions that persisted during July. Paired with lower pressure on the Siberian side, this pattern generates winds that push the ice northward and reduce the total ice extent, especially since much of the ice pack is spread out.
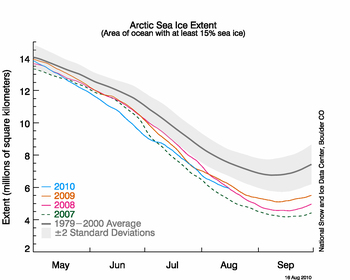
Figure 2. The graph above shows daily Arctic sea ice extent as of August 16, 2010. The solid light blue line indicates 2010; dashed green shows 2007; solid pink shows 2008; solid orange shows 2009; and solid gray indicates average extent from 1979 to 2000. The gray area around the average line shows the two standard deviation range of the data.
Early clearing in the Northwest Passage
Stephen Howell, Tom Agnew, and Trudy Wohlleben from Environment Canada report that sea ice conditions in the Northwest Passage are very light. Ice is still present at the mouth of the M�Clure Strait, in central Viscount-Melville Sound, and in Larsen Sound, as of early August. As a result, neither the northern route (Western Parry Channel) nor the southern route (Amundsen�s Passage) through the Northwest Passage are completely clear of ice. Sea ice area within the northern route is currently well below the 1968 to 2000 average and almost a month ahead of the clearing that was observed in 2007, according to ice chart data from the Canadian Ice Service. In the southern route, there is still a substantial amount of ice.
This year�s early clearing of sea ice probably resulted from record warm temperatures this past spring over the Western Canadian Arctic, as well as the decline in older, multiyear ice in the channel over recent years. Spring 2010 was the warmest in the region since 1948: some regions of the Western Canadian Arctic were more than 6�C (11�F) above normal. These warm conditions helped break the ice up early in the northern route. If winds push sea ice away from the entrance to M�Clure Strait, the northern route of the Northwest Passage could open completely this year. However, even scattered sea ice remains a significant threat to navigation.
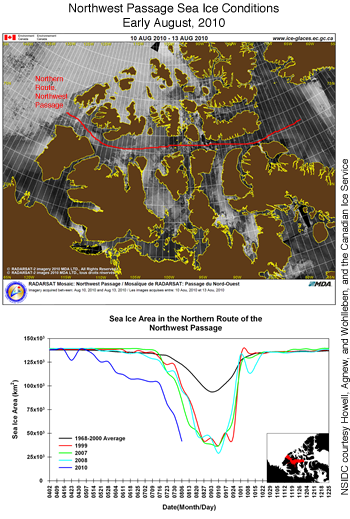
Figure 3. Top: This image, from the Canadian Space Agency's RADARSAT-2 satellite, shows the northern route of the Northwest Passage this August; although the passage is not completely open, sea ice cover is light. Bright, circular and other sharply defined shapes are sea ice; dark grey indicates calm ocean; white smudged regions are areas of ocean that have been roughened by winds. Bottom: The graph of ice area in the northern route of the Northwest Passage shows that ice retreated earlier than normal. The blue line tracks the area of sea ice for 2010, compared to average and to previous low ice years.
History of the Northwest Passage
Conditions in the Northwest Passage are quite variable and do not necessarily reflect overall conditions in the Arctic. However, today�s conditions in the Northwest Passage would likely astonish 19th century explorers such as McClure, Franklin, and Amundsen. In upcoming decades, the passage will be increasingly likely to open during summer.
Last month, Canadian investigators located the wreckage of the HMS Investigator, which sank on an expedition led by Captain Robert McClure in the 1850s. The McClure expedition had set out to rescue the Franklin Expedition, which had gone missing after leaving Baffin Bay for the Northwest Passage in 1845. McClure attempted to enter the passage from the west through what is now called M�Clure Strait, but quickly became trapped in the ice. They remained trapped through two winters before being rescued by another ship. The Franklin Expedition was not so fortunate: all 128 men perished. It was another fifty years before Norwegian Roald Amundsen and a small crew successfully navigated the passage. Their trek, by the southern route, took over two years.
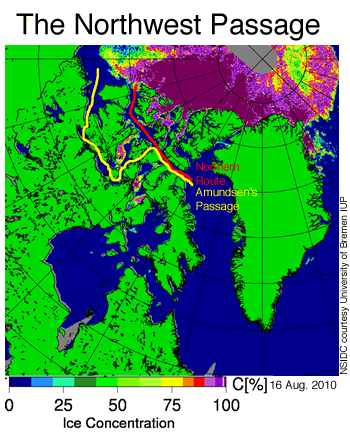
Figure 4. This map shows ice concentration on August 16, 2010, from the NASA AMSR-E sensor on the Aqua satellite. Lines mark two well-known routes through the Northwest Passage: Amundsen's route is yellow, and the northern route is red.
Melt onset
Despite a late spurt in ice growth this past winter, air temperatures remained higher than normal during spring and early summer, leading to an early melt onset over parts of the Arctic Ocean, though onset was later in other areas. Compared to the 1979 to 2000 average onset date, melt began one to two weeks earlier in the eastern Arctic. The central Arctic melt onset date was about average. In contrast, melt started about a week later than average in the western Arctic, including the Beaufort, Chukchi and East Siberian seas, and in the Bering Sea, one of the regions that experienced a surge in ice growth late in the winter.
Recent work by Thorsten Markus at NASA Goddard Space Flight Center shows that date of melt onset got steadily earlier from 1979 to 2008, in all regions of the Arctic except for the Sea of Okhotsk. Although this year showed some areas of later melt onset, compared to normal, the overall trend remains towards earlier melt. The largest trend is in the Barents Sea, where ice melt has begun about seven days earlier each decade since 1979.
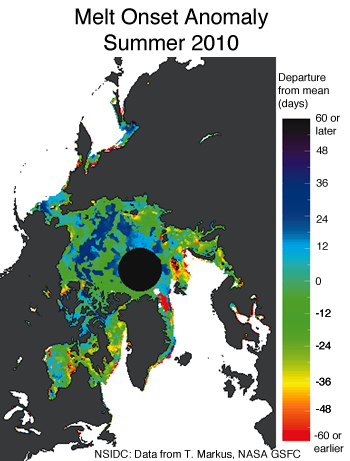
Figure 5. This image shows melt onset anomalies in the Arctic Ocean for 2010, compared to the 1979 to 2000 average. Green, red, and yellow indicate areas of earlier melt onset, while blue and violet show regions of later melt onset. White and black indicate regions with no data.
EDIT/END
http://nsidc.org/arcticseaicenews/index.html