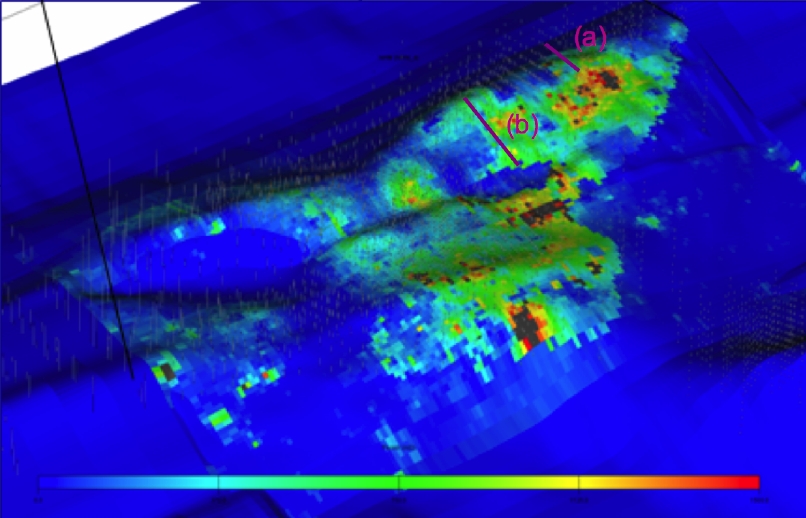
Reservoir simulation visualization of rock permeability in 'Ain Dar and Shedgum regions at northern end of Ghawar field. Scale runs from 0 (blue) to 1500 Millidarcies (red). Source: Figure 12 of Hussain et al, International Petroleum Technology Conference Paper #10395, November 2005.
Background
I have been arguing recently that, since about the middle of 2004, Saudi Arabian oil production has been supply constrained, and that in particular the production declines since the middle of 2005 are not voluntary. See Saudi Arabian Oil Declines 8% in 2006 and A Nosedive Toward the Desert. Also see, for a contrasting view, Euan Mearn's posts Saudi Arabia and that $1000 Bet, and Saudi Production Laid Bare. Behind the scenes, Euan and I have exchanged a lot of email trying to figure out the points of agreement between us, as well as the remaining areas of disagreement.
I see that Cambridge Energy Research Associates continues to have a radically different view of future (2015) oil supply: "Saudi Arabia was ranked No. 1. Its output was forecast by Cambridge to grow to 14.3 million barrels per day from 2005 output of 12.7 million bpd." I suppose if one thinks they produced 12.7mbpd in 2005, then one is in fantasy land about the past, never mind the future.
EDIT
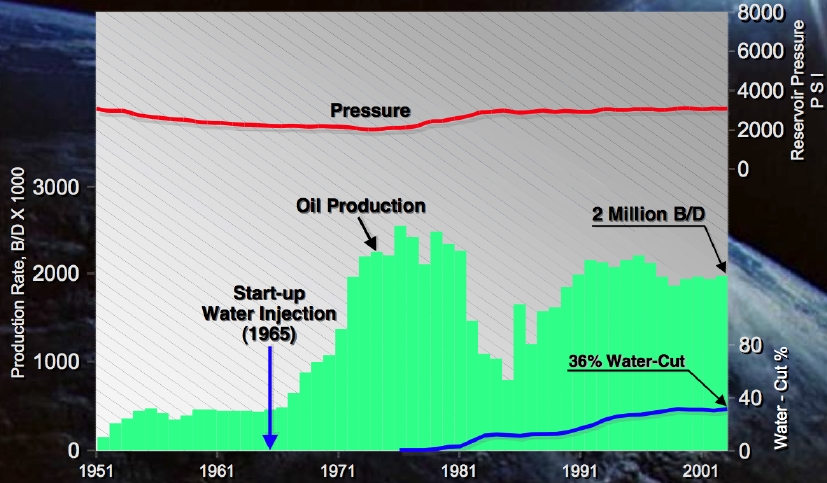
Data for the production history of 'Ain Dar and Shedgum together were given by Baqi and Saleri in their presentation to CSIS in February 2004 (the presentation that was essentially trying to refute Matt Simmons' concerns). Those data look as follows:

Saudi Aramco summary of production history for 'Ain Dar and Shedgum together. Source: Fifty-Year Crude Oil Supply Scenarios: Saudi Aramco's Perspective, Presentation to CSIS, Feb 24th, 2004.
As you can see, production has recently been running at around 2mbd. This graph shows annual data through 2002. If we look at the Water Management in North 'Ain Dar paper, we get an annual production series just for North 'Ain Dar, which suggests that region was about one quarter of the total production of the whole 'Ain Dar/Shedgum north end:

However, there are other indications in the paper suggesting that trouble cannot be far off at all. Let's look at this picture of the state of the reservoir in 'Ain Dar. This is taken from a paper titled Water Management In North 'Ain Dar, Saudi Arabia by Alhuthali et al and published by the Society of Petroleum Engineers as Paper #93439 in March 2005. Fractional_Flow pointed us to a bootleg copy that somebody put up, but if that disappears, you can get the official version behind the paywall.

Two cross sections of a reservoir simulation of the northern portion of the 'Ain Dar region of Ghawar at various years. Color represents volumetric water saturation in the rock pores. Source: Figure 9 of Alhuthali et al, Society of Petroleum Engineers Paper #93439, March 2005.
This is from a numerical simulation of the development of the reservoir over time. However, Saudi Aramco history-matches their reservoir models with extensive amounts of well log data, so it is probably a reasonably accurate picture of the history of the field. The variable being plotted is water saturation - that is the percentage of the pore volume in the rock that is filled with water, rather than oil. In Ghawar, the reservoir pressure has been maintained such that there is no gas cap (the gas is dissolved in the oil), and so the pores are filled with oil, water, or a mixture. You can get the general idea of the figure - at the beginning (in 1940) the crest of the reservoir was almost all filled with pink (ie oil with less than 5% water) and red (less than 25%). As time has gone on and more water has been injected at the periphery, there is less and less dry oil like that, and instead there are green and pale blue areas which are 50%-80% water by volume.
Now, your first thought might be this: if there is 10% water and 90% oil in a particular volume of rock (pink areas in the figure above), then a well into that part of the rock would be receiving 10% water and 90% oil. Similarly, an area with 60% water and 40% oil might be producing at 60% water cut into a well into that area. However, this is not so: the difference is much more dramatic than that. The reason has to do with the physics of two phase flow in a permeable medium. If you want a mathematical treatment, try this, but let me try to illustrate the basic idea.
In a set of interconnected pores through which oil and water are being forced at pressure, the flow is too turbulent for large areas of the two fluids to separate out from one another. And yet, oil and water do not like to mix, and will tend to bead up in the presence of the other. If there is only a little water and a lot of oil, then the oil will form an interconnected network of fluid throughout the rock pores, whereas the water will tend to make small beads within the oil. Conversely, a little oil in a lot of water will result in a network of water throughout the rock, and small beads of oil within that network. Now, in either situation, the fluid that is interconnected can flow through the rock without making any change in the arrangement of beads and surfaces between oil and water. However, the fluid that is beaded up can only move by the beads physically moving around, and they are going to tend to get trapped by the rock pores.
So for this reason, in a mixture of almost all oil, the water cannot flow at all. Conversely, once there is almost all water, the oil cannot flow at all (which sets an upper limit on the amount of oil that can ever be recovered by a water flood). In between, there is a changeover in which the proportion of oil flowing to water flowing changes much more rapidly than the changeover of the actual mixing ratio. The curve that describes this is called the fractional flow curve.
EDIT
Much, much more at:
http://www.theoildrum.com/node/2393#more