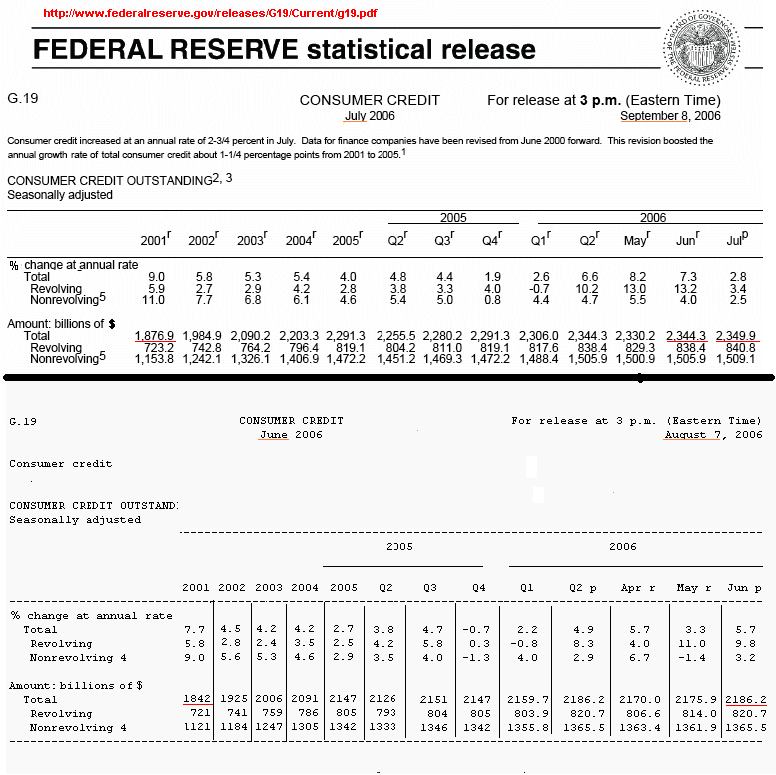
Once again the Federal Reserve has altered previously posted statistics in a less favorable direction. This time they've revised previously posted statistics for Consumer Credit. This increases the total outstanding consumer credit $158 billion, as of June 2006. The initially posted June 2006 consumer credit was revised upward from $2.1759 trillion to $2.3443 trillion. July added another $5.6 billion (or $0.0056 trillion) to the total outstanding credit. If July's increase is added in, it makes the new numbers for total outstanding consumer credit $164 billion higher than June's posted statistics. To put this in perspective, this is about 1.26% of our current, nominal (non-inflation-adjusted) GDP of $13 trillion. Thus from 2000, 1.26% more of our GDP was financed by consumer credit than was originally stated. This makes our current "savings" rate (Disposable Personal Income - Personal Outlays) even more negative than previously stated. These revisions can be seen in the modified copies of the charts from the Federal Reserve shown below.
The top half of the chart shows the most current numbers from September 8, 2006. The bottom half shows the previously posted numbers (prior to the upward revision) published on August 7, 2006. The comparative changes in "total" credit are underlined in red.

The top half of the above table can be found at the
Federal Reserve G19. (The bottom half is from the August release is not available, as it has been upwardly revised.)
For 2005 alone, this upward revision gives an annual increase in consumer credit of $88 billion (from the previously stated $56 billion.) Thus, $32 billion more in consumer spending was financed by borrowing than was previously stated. (This "credit" spending does
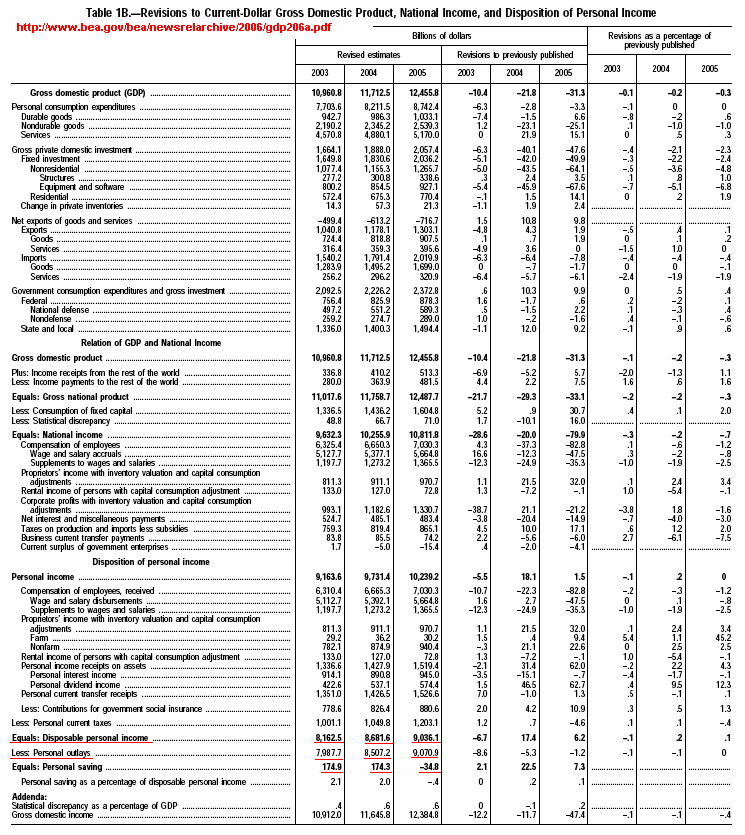
not include consumption spending financed by borrowed money from home equity extraction. Home equity extraction was estimated at between $600-800 billion in 2005. Of this, at least $150-250 billion went toward consumer spending in 2005.) A copy of Table 1B from the BEA's 2nd quarter GDP report (from July) can be seen below.

This above tabel can also be found at
Bureau of Economic Analysis on page 12, Table 1B.
From this earlier report by the BEA from July, the reported annual personal "savings" for 2005 was -$34.8 billion. Without any additional changes (i.e., assuming GDP and consumer spending are not revised, and there are no other offsetting adjustments made) the 2005 savings would change to a -$66.8 billion. In other words,
Americans spent $66.8 billion more than their Disposable Personal Income in 2005.
To give an idea of how large this is, the growth in 2005 non-inflation-adjusted GDP was approximately $744 billion. For 2005, Personal Outlays increased $563 billion in non-inflation-adjusted dollars, while Disposable Personal Income (DPI) increased only $354 billion. (In comparison, the 2004 increase was in DPI was $519 billion.)
Thus, the increase in 2005 Personal Outlays was $209 billion greater than the increase in Disposable Personal Income. This is a major reversal in pattern.
Not since the Great Depression in 1933 have Personal Outlays exceeded Disposable Personal Income.
Normally consumer spending has been 2/3 of total GDP. Meanwhile, Disposable Personal Income increases have been greater than 2/3 of the increase in GDP. The excess of Disposable Personal Income over Personal Outlays is the "savings" rate. Under the Bush administration, however, the excess of income over outlays has been declining. In 2004, the increase in DPI was the same as the increase in Personal Outlays, meaning there was 0 net increase in savings in 2004. This trend has continued and now the "excess" has turned negative. In 2005 consumer spending increased more than personal income. Now the increase in DPI is
less than 2/3 of our GDP. In fact, the increase in 2005 was only 48% as large as our our GDP increase. To make things worse, consumer spending has actually increased to 70% of our GDP. Now there is a huge gap between consumer income and consumer spending. That gap has been filled with borrowed money from both credit cards and home equity extraction.
In 2005, the nominal GDP growth rate of 6.35% declines to 3.15% when adjusted for inflation (using the BEA's GDP deflater.) Meanwhile, the nominal increase in DPI of 4.08% declines to 0.88% when adjusted for inflation. Maintaining a GDP growth rate greater than the increase in Disposable Personal Income is completely unsustainable, especially when the gap is this large. Growth in real GDP usually reverts to a level that is less than Disposable Personal Income growth. In this case, that growth rate would be below 0.88% annually.
Again, increasing GDP through deficit-financed consumer spending is not sustainable in the long-run. We will soon find out when this short-term phenomena hits a dead-end created by its long-term unsustainablility.
unlawflcombatnt
EconomicPopulistCommentaryEconomicPatriotForum___________
The economy needs balance between the "means of production" & "means of consumption."