professionally run campaigns in the history of the US.
What I would be really interested in is the copies of the emails that were sent that were able to raise a crowd of 30,000 in 24 hours. (By the way if your interested I can get you several emails from people who think that the Apollo landing on the moon was staged, really really convincing evidence)
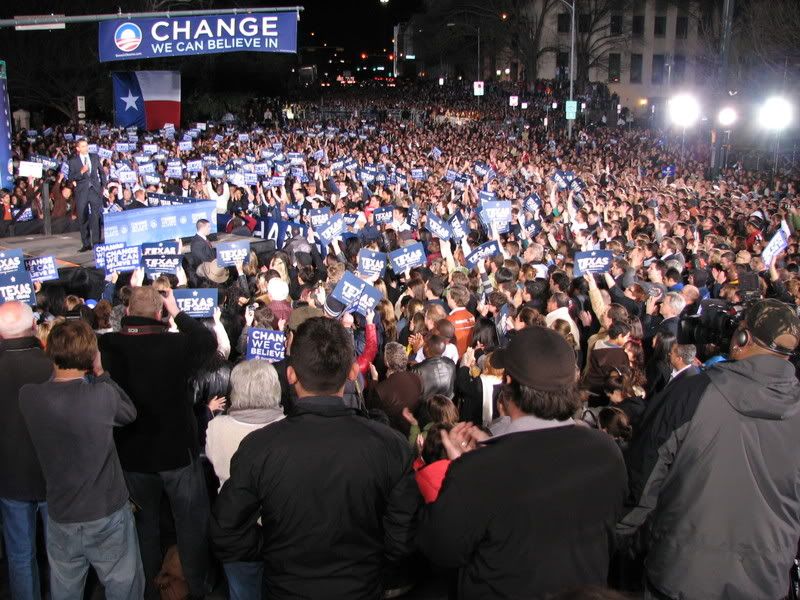
Austin, we did it again. We might have just pulled off the biggest rally in the country...again! And this time, we had only 24 hours notice. Incredible!
We'll never know the exact number of people who came to downtown Austin tonight to cheer on the next President of the United States. Some estimates have the crowd size closer to 40,000...but we'll go with the more conservative number. No doubt, it was a Texas-sized rally!
We had 6,000 people in the holding pen near the stage. We had about 15,000 more people stretching south down Congress Ave, and another 10,000 stretching east up 11th Street. The crowd was so big that we had to put up a giant jumbotron on 10th and Congress so that people could see Barack. Our campaign headquarters is at 9th & Congress, and the crowd stretched all the way back to our office. Unbelievable.
Thanks to all our volunteers who have been working hard since 4:00pm to make this rally a success. This people-powered campaign has inspired a new generation of activists, and we're going take back the White House in 2008.


For my model, I assumed that Anglos would make up 52.6% of the Texas Democratic Primary electorate, that African Americans would be 19.5% of voters, and that Hispanics would make up a greater number of primary voters than in 2004, but that the increase would not be really massive, and would only go up to something like 25.3%. I tried to base these numbers off of the 2004 Texas Democratic Primary exit polls, and off of the polls that have some (different degrees of) crosstab data available, SUSA, ARG, TCUL, IVR, Rasmussen, and ABC/WaPo.
As you can see in the crosstabs, SUSA, Rasmussen, and TCUL allpredict a large increase in Hispanic turnout over the 2004 Democratic primary, and all of those polling organizations have Hillary Clinton ahead, by varying margins. The one polling organization that has Hispanic turnout down or even is ARG, (one can't say which), and that is also the only polling organization that has Obama ahead. ARG is also the only organization that has Obama coming close to even among Hispanics, which brings us to the question of how Hillary Clinton and Barack Obama are likely to fare among voters wedged into the racial categories of "White," "African American," "Hispanic," and "Other."
White voters
SUSA, TCUL, ARG, and Rasmussen all have Hillary ahead by roughly the same margin among white voters, which makes it a pretty easy call for me to assume roughly that same 12-14 point margin for Clinton. The only outlier is ABC/WaPo, which has Obama a bit closer among white voters. The striking results in states like Virginia and Wisconsin suggest that Obama might well close gap or even pull ahead among white voters, but if he is going to do that in Texas, the only poll it has shown up in so far is ABC/WaPo.
African American voters
With the one exception of IVR, the polls all generally agree that Clinton does not pass 20% among black voters, but SUSA and ABC/WaPo seemed to push African American leaners more than ARG or TCUL, and those leaners leant towards Obama. This is broadly consistent with Obama's performance among African American voters in other states, where he has often polled under 80%, but taken 80% or more on election day among black voters. Again, the results out of Wisconsin provide Obamafans with the hope that Obama might extend his dominance to 90%, as he did in Wisconsin, but I am not ready to project that Hillary Clinton will be crushed so massively among African American voters.
Hispanic voters
Among Hispanics, both SUSA and TCUL have Hillary up about 2 to 1 over Obama. ARG stands out, with Obama only behind 6% among Latinos. IVR is an outlier in the other direction - IVR has Hillary up among Hispanics by essentially the same margin that it has Obama up among African Americans. ABC/WaPo has Hillary up by a health margin (59%-36%), but one still less than 2 to 1. I would not be surprised if the results are ultimately pretty close to what the ABC/WaPo poll predicts, but as of now it is only one poll. While ARG has had a spotty record this election cycle, there are several reasons to suspect that it (and ABC/WaPo, to a lesser extent) might be on to something.
1) According to Gallup, Obama has pulled ahead nationally among Hispanic voters. Simply put, unless this is entirely attributable to polling error, it is difficult to imagine how Obama could be gaining nationally among Hispanics but not among Texas' large Hispanic population.
2) Hillary only ever really won 2-1 among Hispanics in a couple of states like California and Nevada. In states like Arizona and New Mexico, where more of the Hispanic population is not first (or even second) generation immigrants, Obama held Hillary's margins down. He also has done well in post Super Tuesday states among Hispanics, although because the Hispanic populations in those states has thus far been small, exit poll data is of only questionable validity.
3) Ron Kirk has shown that the idea that Texas Hispanics will not vote for an African American candidate, even against a Hispanic Democrat in a Democratic primary, is false.
Nevertheless, without more polling confirmation, I assumed in these projections that Hillary Clinton wins 2-1 among Hispanics. SUSA and TCUL speak louder than ARG.
Other voters
In Texas, although there are some native Americans and other mixed race persons, "other race" primarily means Asian American. Hillary Clinton won 3-1 among Asian Americans in California, which might lead Hillary supporters to hope that she can repeat that feat in Texas - and who knows, maybe she can. But there is no Asian vote, and there is also little polling data to indicate how either Asian or Other voters in Texas will vote. The only data is from SUSA, which actually has Obama ahead 56-40 among "Other" race voters. But "other race" makes up such a small percentage of the population that the margin of error must be through the roof, and SUSA's crosstabs don't really tell us much about non-white, non-hispanic, non-black voters in Texas.
Modeling Other Demographics
For my model, I assumed that African Americans, Hispanics, and Other race are monolithic blocs statewide, which is untrue but simplifies matters (you would understand if you saw my spreadsheet formulas). Additionally, much less data is available about how voting patterns among African Americans, Hispanics, and Other race voters voting patterns vary by demographic categories like income than for white voters, and less data is available about the distribution of those demographic categories by State Senate District. For example, I assumed that Hispanic voters in McAllen are just as likely to turn out, and just as likely to vote for Hillary Clinton (or Barack Obama), as Hispanic voters in Dallas, or as Hispanic voters in the rural Texas panhandle.
But for white voters, I adjusted the voter totals based on the difference between the State Senate Districts percentage of voters who are over 65, live in an urban area, make greater than $50,000, have a bachelors degree or higher, and who are college students. My model adjusts the totals based on the percentage of the State Senate District compared to the Texas State average for all of these demographic categories. My model adjusts the totals among white voters in Obama's favor when there fewer voters over the age of 65, when there were more urban voters, when there were more voters who have household incomes in excess of $50,000, when more voters hold bachelors degrees or higher, and when more voters are college students. It adjusts the vote totals in favor of Hillary Clinton when the opposite holds. Even though Obama cut into (and in some cases won) those subsets of white voters in recent States like Wisconsin and Virginia, Obama still did better among college graduates than non-college graduates, etc.
For every voter that is part of the % difference from the State average for the demographic categories of over 65, > 50K, bachelors degree or higher, and college student, I gave a 30% chance that their vote would shift from one candidate to the other, explained by that demographic category. For the rural/urban category, I did the same thing, but only shifted the vote by 10%.

South Texas
My model agrees pretty well with both SUSA and TCUL on South Texas, but may be a bit more favorable to Hillary than either. A much larger percentage of TCUL's sample (32%) than SUSA's (13%) comes from its "South Texas" region, suggesting that TCUL classifies a larger area, including San Antonio, as part of "South Texas."
West Texas
My model is a bit more favorable to Obama in West Texas than either poll, but this is probably because my data uses a loose definition of the term "urban," which seems to include small West Texas towns. In any case, the difference is not going to shift delegates. District 31, for example, is not really 81.5% Urban, which my data says it is. If you shift the Urban demographic number down to a more realistic level, Hillary gains a few percent.
Houston & East Texas
My model has Hillary ahead in East Texas, as does TCUL. SUSA probably has Obama ahead because it has a broader definition of "East Texas," which seems to include Houston. TCUL has Obama ahead by a fairly similar margin in Houston.
Central Texas
TCUL has Obama up big in its "Central Texas" region, which must include Austin. SUSA has a slightly larger "Central Texas" region, which it has going narrowly for Clinton. My model has Obama up by a bit in Austin, and generally down a bit in the rest of the State Senate Districts that might be considered part of Central Texas. My model may well be underestimating Obama's support in Austin, and I suspect it probably is. A full year ago, an Obama rally in Austin drew 20,000 people, whereas in State Senate District 14, which includes most of Austin, my model has Obama receiving 27452. Austin has a liberal culture unique to Texas which may not be fully explainable by differences in Rural/Urban, income, age, and educational demographics.
Dallas/Fort Worth & North Texas
Both TCUL and SUSA have Clinton up by 1 or 2 points in DFW/North Texas. SUSA seems to have a broader definition of North Texas, which probably includes places outside the DFW metroplex like Wichita Falls. My model has Obama up in the North Texas region. My model may be wrong. Or the polls, which have high margins of error for regional crosstabs, may be wrong. It is hard to say.
The John Edwards Factor
John Edwards is still on the ballot. Edwards received up to 15% of the vote in some Louisiana counties on Feb. 9th, even after dropping out, and also did very well in rural Oklahoma. He will surely get some votes, and likely will do relatively well in rural parts of East and North Texas near the Louisiana and Oklahoma borders, as well as in rural parts of Central Texas. Who knows, maybe the areas of Texas near to the New Mexico border, where Bill Richards did very well fundraising, will give him some love as well. The numbers in my model do not take this into account, and give all votes either to Hillary Clinton or Barack Obama. Edwards' votes, at least in rural areas, are probably more likely to come from Hillary Clinton's total.

This East Texas GOP district includes the cities of Texarkana, Longview, Part of Tyler, and surrounding rural areas. All the demographics are unfavorable here to Obama, with the one exception of the African American percentage. The rural, white, over 65, non-college educated demographics all point my model towards showing Hillary winning the popular vote, but the 4 delegates here should split 50/50. It's worth noting here that the data on urban/rural population seems to generously define "urban" to include suburban areas and smaller towns.

This GOP district includes the Dallas suburb of Rockwall, some East Dallas exurbs, and rural areas. The above average AA population, the above average > 50K vote (concentrated in the DFW suburbs), and the urban vote should keep Obama close enough to split the delegates evenly. Hillary should carry the popular vote in the rural areas, but have more trouble in the Dallas suburbs.
27 other districts analyzed here:
http://blog.texansforobama.com/showDiary.do;jsessionid=AED0781D3814A37DAA1FAF08167D0A83?diaryId=891The Texas Caucuses
As mentioned previously, 67 of Texas' delegates will be determined by caucuses. Senator Obama has been doing very well in caucuses with the exception of the Nevada caucus,, in which he won the State delegates but lost the precinct delegates. Nevada has at least two relevant similarities to Texas - it has a high Hispanic population, and both campaigns will have a major presence, have a decent amount of time to set up their organizations, and will be strongly competing. In a great blunder, Hillary basically ignored most of the caucuses that Obama did very well in, which the exception of Maine. But she is not doing that in Texas. She has more than 4000 precinct captains signed up, and while Obama has in excess of 8000 precinct captains who can make calls, print up flyers, and print up canvassing walklists from Texasprecinctcaptains.com, but 4000 is nothing to sneeze at either, and it really depends on whose precinct captains actually do the work and turn out their voters. So while I would still favor Obama to win the Texas caucuses, don't believe the hype that Hillary has no chance at winning the caucuses. It is possible that she will do so.
So my projection (really more of a wild guess), is still that Obama will win the Texas caucuses 55%-45% The delegate breakdown for that is:
Obama: 55% - 25 At Large delegates - 14 PLEO delegates
Clinton: 45% - 17 At Large delegates - 11 PLEO delegates
In sum, my combined updated 31 State Senate District and Texas Caucuses projection (includes all of Texas' pledged delegates) is as follows:
Total Projected Delegates
Obama: - 102 Delegates
Clinton: - 91 Delegates