I posted yesterday on the idea that though housing has declined dramatically housing is NOT cheap. (
http://www.democraticunderground.com/discuss/duboard.php?az=show_mesg&forum=132&topic_id=8218915&mesg_id=8218915 )
In fact, I am forced to the conclusion that housing today is, even after all the collapse we have seen so far, probably more overpriced than it was ten years ago. (Ten years ago it was reasonable to expect houses to go up so they offered much better value.)
Every single day of a bear market analysts say "This is a good time to buy into this market because stocks are so cheap." "Cheap" in stock terms traditionally means with low Price to Earnings ratios. But when vapid analysts say "cheap" they are usually saying, "A lot lower than they were." Having sold off does not imply value and usually implies the opposite. Things that are priced low are priced low for a reason. (people said CITI was a steal at $10 because it had fallen from $55. It was not a steal at $10. It's in the $2-$3 range today.)
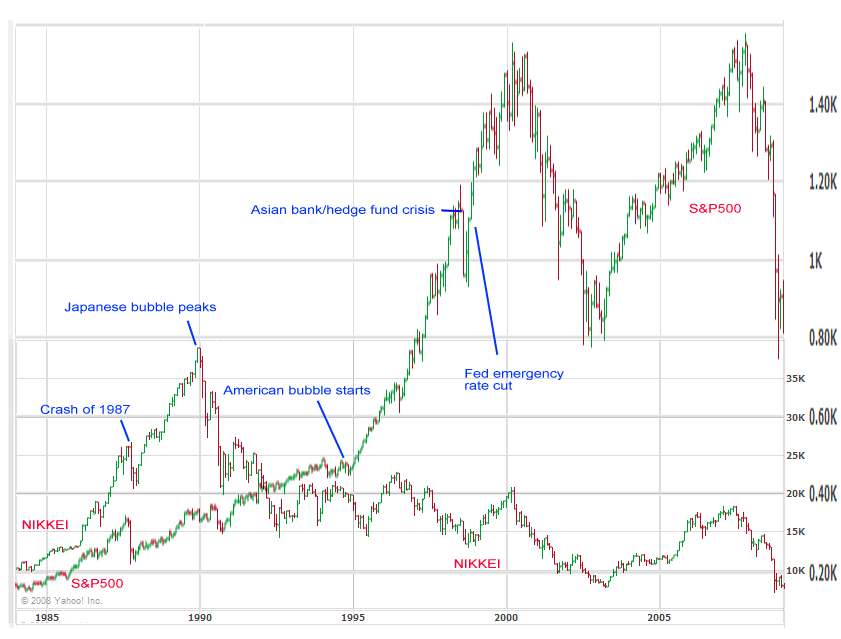
This is why nobody should have been fooled by the supposed collapse of the internet bubble. Bubbles do not burst in a polite, orderly way that returns things to friendly historical trendlines. Bubbles take out the whole cake, not just the frosting. The freak-show attractions like pets.com having a market capitalization in the billions were low hanging fruit and easily washed out of the system. But the internet bubble was a bubble in ALL stocks. After the Internet bubble "collapsed" blue chip stocks were still at or above historical valuations relative to earnings. And they went up from there, challenging the old bubble highs. So the stock bubble never really burst, until recently. (see chart at bottom)
Similarly, the housing bubble will probably be full of false bottoms along the way. People cannot imagine an event that actually destroys our economy so it is wished away. "That just
couldn't happen!"
My intention is not to frighten people, but to offer some realism on our situation. It can get dramatically worse.
The Standard and Poor's Case-Shiller housing 20 city indexes are calibrated at "January 2000 equals 100.00" so all the figures are a percentage of 2000 prices. "120.00" means 120% of whatever the average price was in 2000.
January 2000 was at the height of stock bubble 1.0. The percentage of Americans owning homes was at an all time high. Stocks were at record prices.
Now, let's look at where the home price averages are today versus January 2000 in today's new C-S S&P report (Which is available as an .xls spreadsheet file online.)
http://www2.standardandpoors.com/spf/pdf/index/CSHomePrice_History_022445.xlsAZ-Phoenix 123.93
CA-Los Angeles 171.46
CA-San Diego 152.16
CA-San Francisco 130.12
CO-Denver 125.74
DC-Washington 176.34
FL-Miami 165.01
FL-Tampa 156.04
GA-Atlanta 113.87
IL-Chicago 137.16
MA-Boston 153.05
MI-Detroit 80.93
MN-Minneapolis 127
NC-Charlotte 122.41
NV-Las Vegas 131.4
NY-New York 183.5
OH-Cleveland 105.21
OR-Portland 158.5
TX-Dallas 115.63
WA-Seattle 160.19
Composite-10 162.17
Composite-20 150.66
Look at the housing bubble hot-spots. LA, San Diego, Florida, Las Vegas... we are told home price in Las Vegas have fallen to the center of the Earth but they are still up from 2000 by way more than inflation. And Los Angeles, a city devastated by falling housing prices, is at 170% of 2000.
If the stock market was at 170% of where it was in 2000 would anyone be saying the stock sell-off had run its course, or that stocks are cheap?
Housing is not cheap and probably has a long way to fall yet. And I say that with no pleasure. (I have skin in this game, not a snarky by-stander rooting for catastrophe.)
But the implications are what they are. We need to be doing things a lot bigger than big.
_____________________________
Appendix: chart offered to give a quick visual check on whether the supposed collapse of the stock bubble in 2000-2001 was really a bubble collapse with capitulation, taking out all sorts of historic lows. In retrospect it looks like a "bear trap" correction within a bubble rather than an actual bubble collapse. It makes me nauseous to say this, but glancing at this chart one would expect the S&P 500 to break 400 on th downside. I hope, hope, hope that doesn't happen.
The chart also shows the long, slow demise of Japan with many head-fakes along the way when people were sure it had hit bottom.
NOTE: The label "American bubble starts" should probably be in 1996-1997, not 1995. The dramatic inflection upward in 1995 reflected real productivity gains from technology so it wasn't all froth at first. (Interestingly, there is no 1995 inflection in home prices but there IS an inflection in % of Americans owning a home at the same point stocks started up. Don't know what it means, but it's interesting.)
